The graphs on the Ed-Data website hold a wealth of hidden information that you can easily access with a few clicks. You can also copy or print graphs, share them on social media, email a link to a specific graph, or download the data into Excel. This article explains how you can get the most out of the Ed-Data website so that you can find and share information about your school, district, county, or California with others.
What You Can Do with Ed-Data Graphs
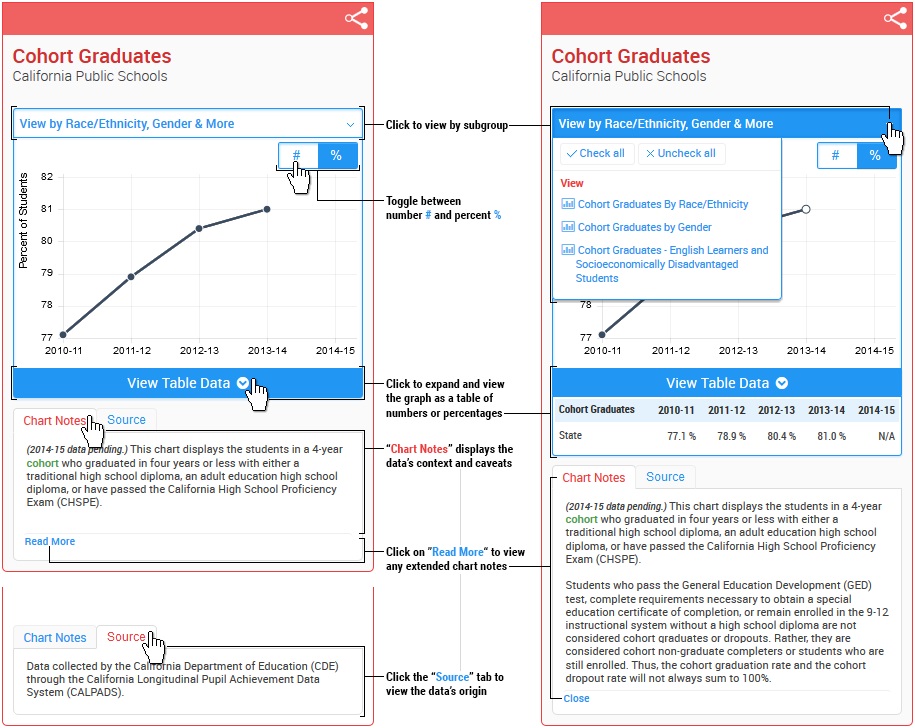
On any Ed-Data graph, you are just a click away from seeing the table of numbers for that graph. Many graphs enable you to toggle between viewing counts or percentages and, where available, you can "drill in" to view data by subgroup such as race/ethnicity, gender, and socioeconomic status. You can even filter out data elements to focus the graph on the data you want to see. The picture below shows how to get to the different levels of data:
Ed-Data invites you to use and share Ed-Data graphs under the Creative Commons Attribution-No Derivatives 4.0 International License. To learn more about how to share, print, email, copy, and save Ed-Data graphs and how to export the data into an Excel spreadsheet, please scroll down. To learn more about the Creative Commons Attribution-No Derivatives 4.0 International License, read the Ed-Data Terms of Service.
The Share Icon and Menu
Start sharing by clicking on this icon on any graph
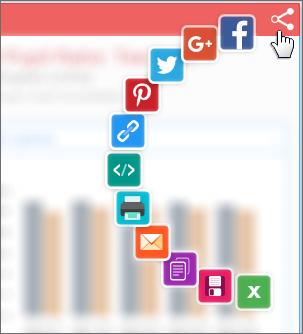
You'll see all of your sharing options in this wheel
What Can Be Done
Share graphs on social media
Click on the Pinterest, Twitter, Google+ or Facebook icons to share the graph via any of those social media sites.
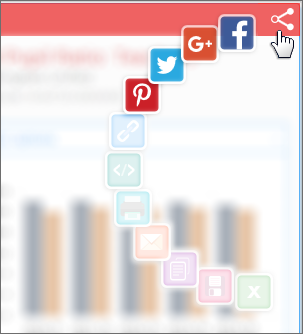
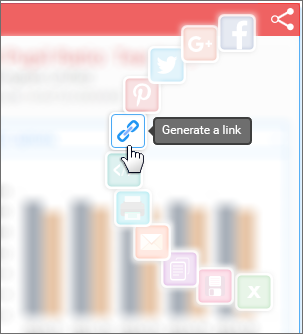
Generate a link to the graph
Use this icon to get a link to the graph. Once you have the link, you can save it, email it, or embed it into a document or presentation.
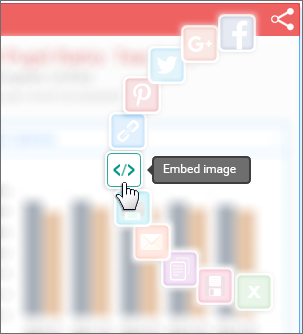
Embed an image of the graph into your code
Use this icon to embed the image of this graph into your html code.
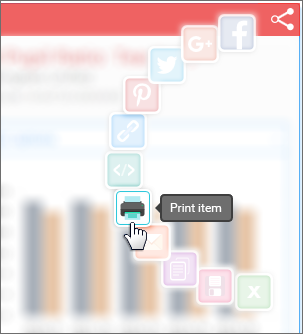
Print a graph
Use this icon to print a graph.
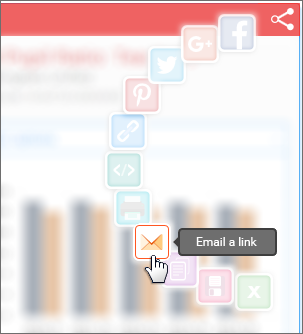
Email a graph
Use this icon to email a graph to someone.
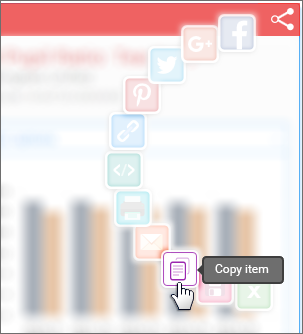
Copy a graph
Use this icon to copy a graph so you can paste it into a document or presentation. Note that the quality of the copy will be better in browsers other than Internet Explorer (IE). Graphs saved via IE will be slightly blurry.
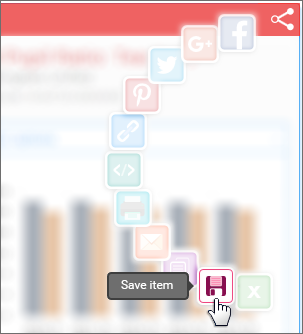
Save a graph
Use this icon to save a copy of a graph.
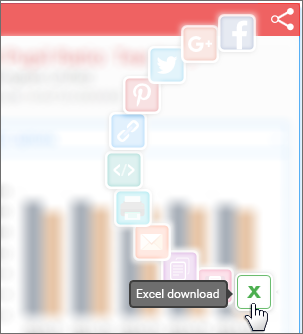
Export the data to Excel
Use this icon to export the graph's data to Excel.
The Ed-Data partners hope the Ed-Data sharing functionality stimulates helpful conversations about data. We'd love to hear from you about how you've used this functionality. Please use the Contact tab in the footer to share your experiences.